Treemaps
vignette-treemaps.RmdThis panel shows a treemap both in terms of read numbers (left) and of number of ASVs (right).
Total read number per sample has been normalized to 100 with 3 decimals so that the value displayed in the different panels on the left size correspond to % of total eukaryotic reads.
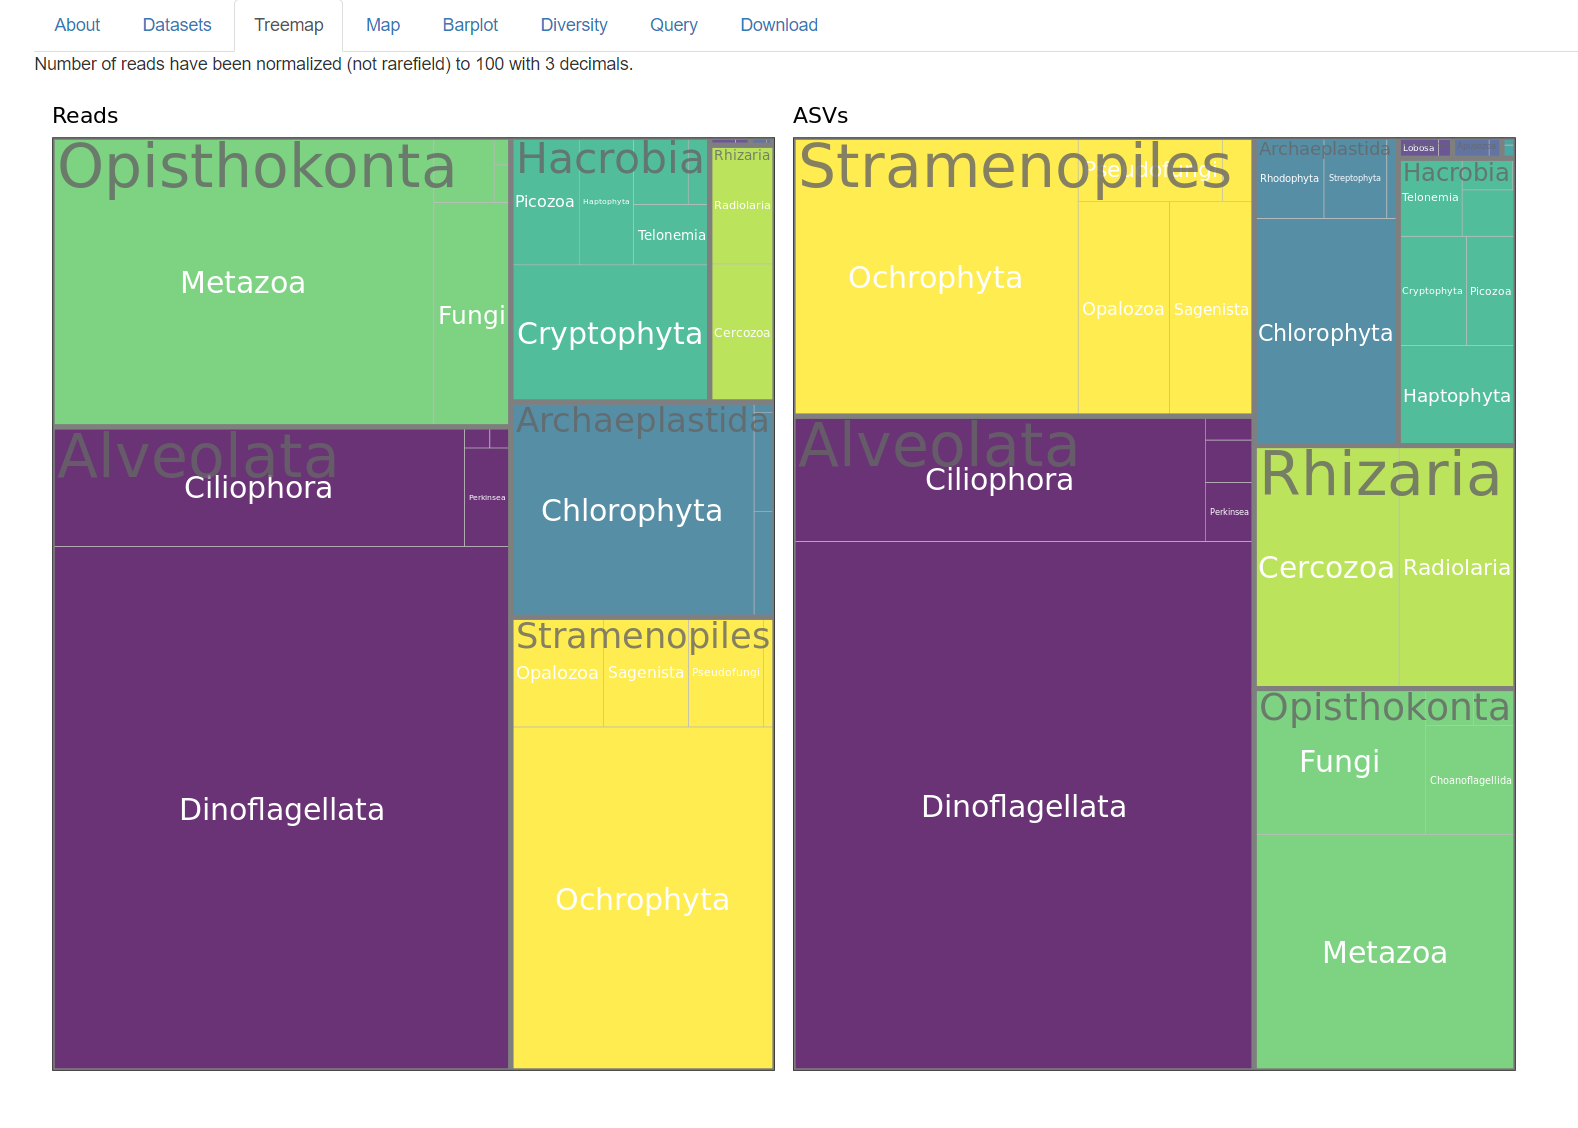
Fig.1: Treeemap.