Plotting sequence location
Daniel Vaulot
Source:vignettes/pr2_03_geo_origin.Rmd
pr2_03_geo_origin.RmdLoading the database
library("pr2database")
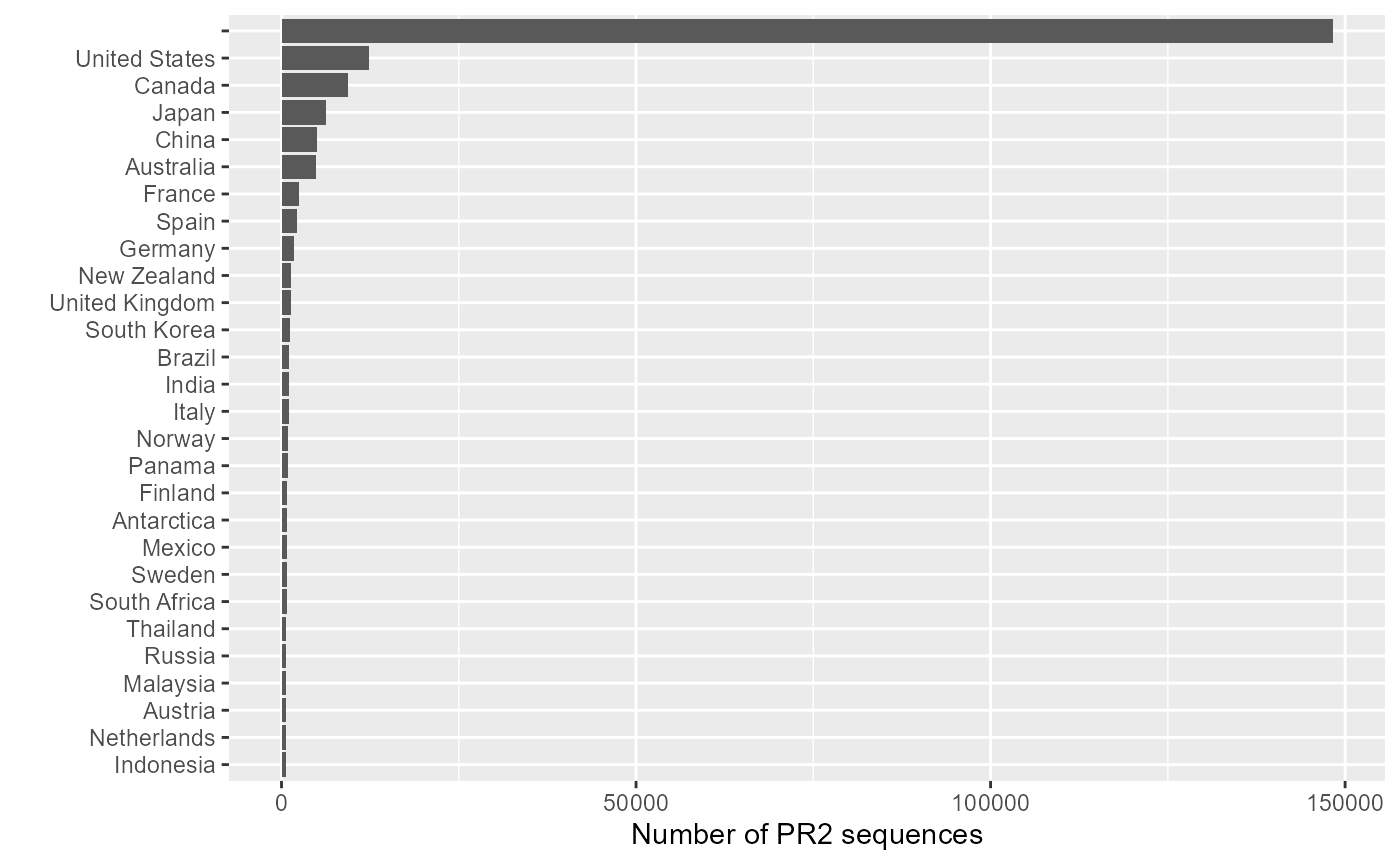
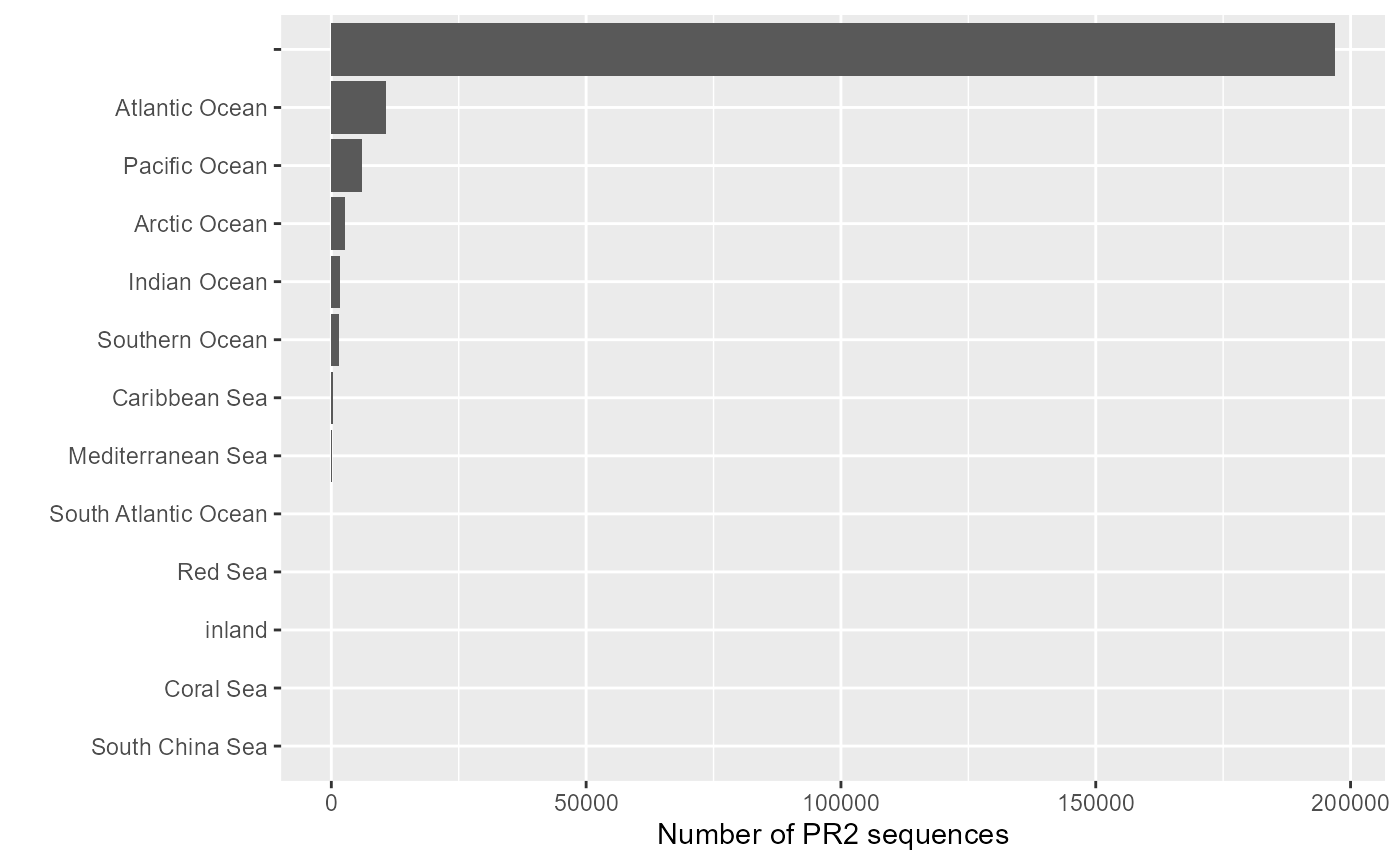
pr2 <- pr2_database()Plotting number of sequences per country and ocean
A very good tutorial by Margaret Mars Brisbin on how to combine PR2 metadata with Python to locate sequences using all the metadata information (lat, long, country and fuzzy localization): https://maggimars.github.io/eukGeoBlast/eGB.html and https://github.com/maggimars/eukGeoBlast. This code has been used to incorporate more geo-localisation information into PR2 version 4.12.0